SSAM’s manual
Description of Spatial Sustainability Assessment Model (SSAM)
Installation
The plugin works under QGIS 3.0 environment, but the first time we use it we need to follow the installation procedure:
- from the menu Plugins choose Manage and Install plugin, the Plugin manager window will open;
2. if SSAM is already installed, we will find it under the installed plugins in Plugin manager. Otherwise, the plugin will be listed under Get more and we can install it by clicking on Install plugin;
- after the end of installation procedure, SSAM will be accessible from the menu Plugins;
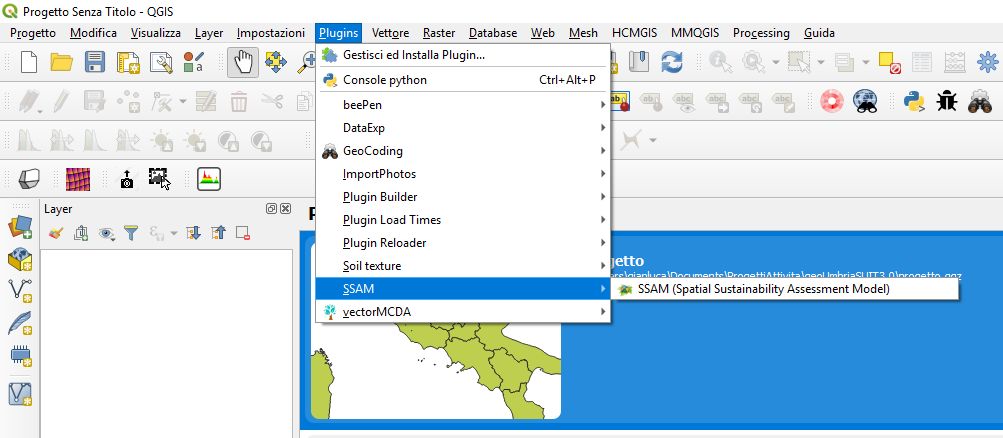
Figure 1: Plugin manager in QGIS
Running SSAM
The user has to load a vector geographic data in qgis and select it clicking with the mouse over the name. The attribute table of that file has to contain the indicators we intend to use in the assessment. The user can download example data from the site http://maplab.alwaysdata.net/SSAM.html. From the menu Plugins we can select SSAM and the window shown in figure 2 will open; only the first tab (Setting) will be active.
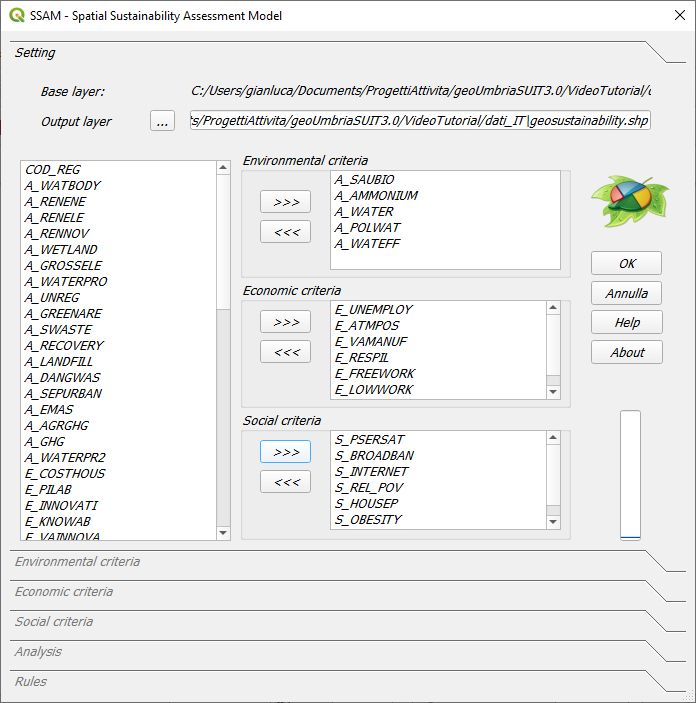
Figure 2: plugin SSAM, with the Setting tab active
In the box Base layer the path and the name of the file used for the analysis (base layer) are shown and selected by the user before starting SSAM. In the box Output file the user can select the path of the output file that will be generated during the simulations with SSAM. The plugin shows a default path, but the user can change it as he prefers.
If the check use prefix for criteria in the box Prefixes criteria is selected, the criteria will automatically be qualified as environmental, economic and social by a specified prefix, respectively named A_, E_, S_. For example, we can register the indicator Particular matter in air - PM10 as A_PM10 in the table of attribute and SSAM will qualify it as an environmental indicator. The same will be done with the others social (S_) and economic (E_) indicators.
If the user does not select any prefix, he has to select the indicators according to the three dimensions of sustainability in the next step, picking and selecting each single field from the table of attributes. When the setting page is completed, the user can click on OK button for preparing the analysis and activating the others pages.
On the Environmental criteria, the label Layer shows the original file from which we take the data; this file will not be modified during the analysis. The most important section is the central table, were the columns are labeled with the field in the table of attributes of the original file.
In figure 3, for example, we have only two fields: A_GAS_SERR and A_ELET_RIN, because we have chosen to use the A_ prefix as environmental identifier in the previous Setting page. In this way, SSAM has selected all the fields in the table of attributes wit prefix A_ and used it for the environmental analysis, as Environmental criteria.
If we did not choose to use the prefix, we will have to select all the criteria we need from the attributes table using the buttons Add and Remove, selecting all the fields with the environmental meaning (the same thing in the economic and social pages).
The row Label in the table describes the name of the field/criterion in an extensive and more expressive way, in comparison to the limited space reserved in a shapefile for the name. The Weights field holds the weights for the criteria in the columns.
The user can insert the weights digiting the values in the cells, otherwise he can use the Advanced method, using the pairwise comparisons table. With the row Preference the user can choose the preference related to each criterion: if the highest value is preferable in terms of sustainability, the value is Gain; on the contrary, if the lowest value for the criterion is preferable in term of sustainability, the user has to select Cost. The values Cost/Gain are mutually exclusive, and the user can choose the right value clicking alternatively on the cell.
The Ideal point e Worst point cells are filled with the default values picked from the attributes table. SSAM selects the best and the worst value for each criterion from the attributes table and proposes this values to the user. For example, the criterion Energy from renewable sources, is a gain criterion (high values are preferable) and the default Ideal point is the highest value from this criterion in the attributes table. The Worst point, instead, is the lowest value from the attributes table for the criterion Energy from renewable sources. Otherwise, the criterion Particulate matter – PM10 in the air, is a Cost criterion and the default Ideal point value, picked from the attributes table, is the lowest value, while the Worst point is the highest one. The user can modify the default values with others, like law limits or policy targets, simply digiting the right value in the cell .
The user can press the Save button for register all the values in a file (setting.csv) for using the setting parameters in the next simulation for the same geographic file.
Pressing the Apply button the environmental index will be calculated based on the TOPSIS algorithm. Obviously, only the environmental criteria will be used in the calculation. All the operations described for Environmental criteria, with the same meaning, will be repeated for Economic criteria and Social criteria pages, for the calculation of economic and social indexes. At the end, we will have one index for each of the dimensions of sustainability.
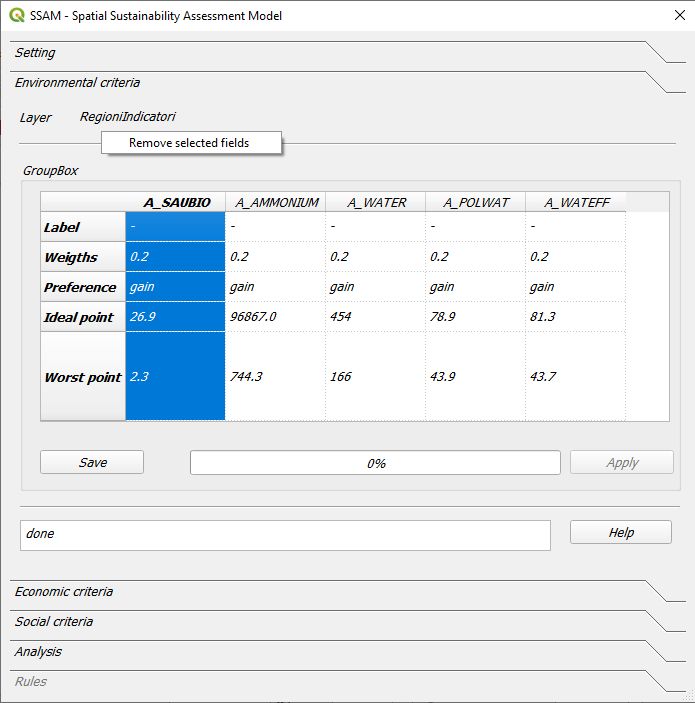
Figure 3: Environmental criteria
Therefore, the steps and commands to be given in the Economic criteria and social criteria pages are the same as we saw for Environmental criteria. The order of elaboration is not important, but all the pages must be completed clicking on the button Apply. Otherwise, only a partial evaluation will be done. We always can check if a component (environmental, economic or social) has been elaborated: if the Apply button is active, the elaboration has not been performed, otherwise the calculation is completed and we can go to the next step.
Outputs
The page Analysis [figure 4] allows the user to get the outputs provided from the plugin. We can have three types of output:
- cartographic: pressing the Load maps button, SSAM loads four thematic maps, showing the environment (EnvIdeal), economic (EcoIdeal), social (SocIdeal) and the comprehensive sustainability performance of each research unit, based on the related indexes. The user can change the class numbers changing the value in Classes map control, but the label will be only numeric, from the lowest to the highest value.
- graphic: the user has to select the field used for labeling the research units from the combo-box Label field. For example, if our assessment concerns the Italian regions, we have to select the field that holds the name of the regions. The same for Provinces, municipality or other administrative or phisical units. Pressing the Graph button, SSAM will load an html page in a web browser with four graphs. The first shows a stack – histogram whose the overall height is proportional to the sustainability value, as the sum (linear combination) of the three indexes (environmental, economic and social values) calculated using TOPSIS algorithm. The second graph is a bubble-graph: the position, dimension and color of bubbles provide information about sustainability and its three dimensions. In particular, the x-axis is ordered with the environmental index, the y-axis is ordered with the economic index, while the color (from red to green) is ordered with the social index; the dimension of the bubble is proportional to the sustainability value. The first two graphs use Google chart API’s and require an active internet connection. The third and the fourth graphs are quite similar to the the first two, but they are static and they do not require an internet active connection.
- alphanumeric: SSAM implements the Dominance Based Rough Set theory [5] for discovering and explaining the data outputs. In the page Rules there is a button named Extract rules, for the extraction of decisional rules on the basis of a classification given from TOPSIS algorithm. If a rule has a syntax like IF A>= X THEN AT LEAST i-th, we can read it as: ** if criterion A has a value greater than or equal to x, then the class of membership will be at least the i-th . On the other hand, if the extracted rule has the syntax like **IF A>= X THEN AT MOST i-th, it can be read as: If the criterion A has a value greater than or equal to x, then the class of membership will be at most the i-th **. If the user selects a single rule, the **research units covered from that rule will be selected. In other words, selecting a single rule from the text box, we can see the examples which support that rule.
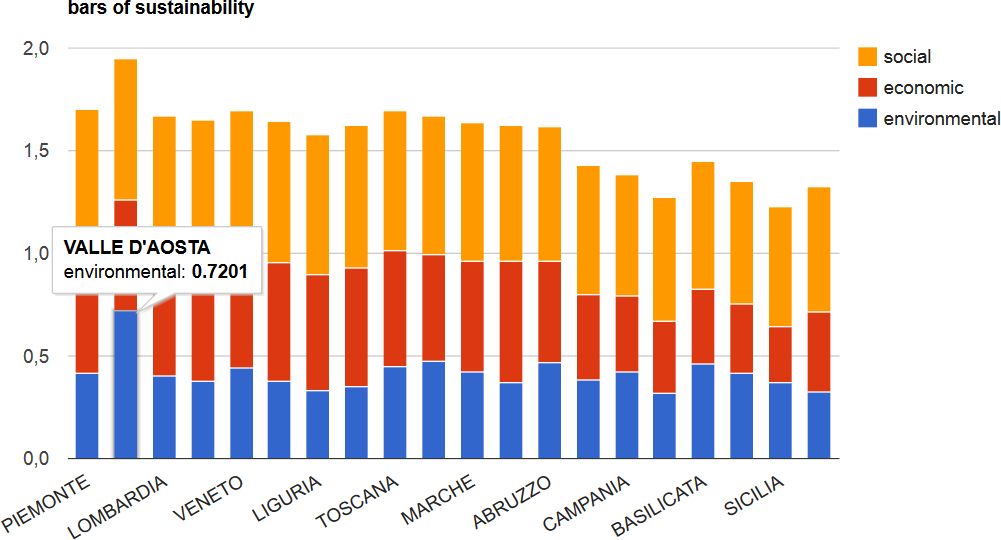
Figure 4: Sustainability Histogram
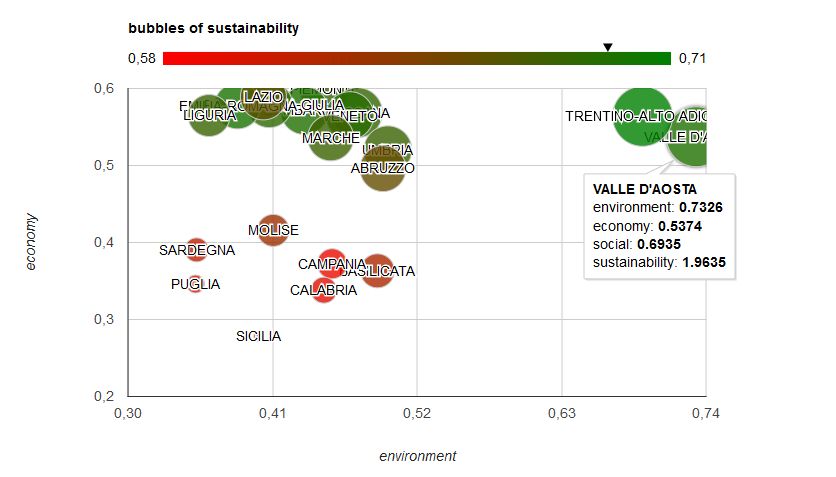
Figure 5: Sustainability bubbles
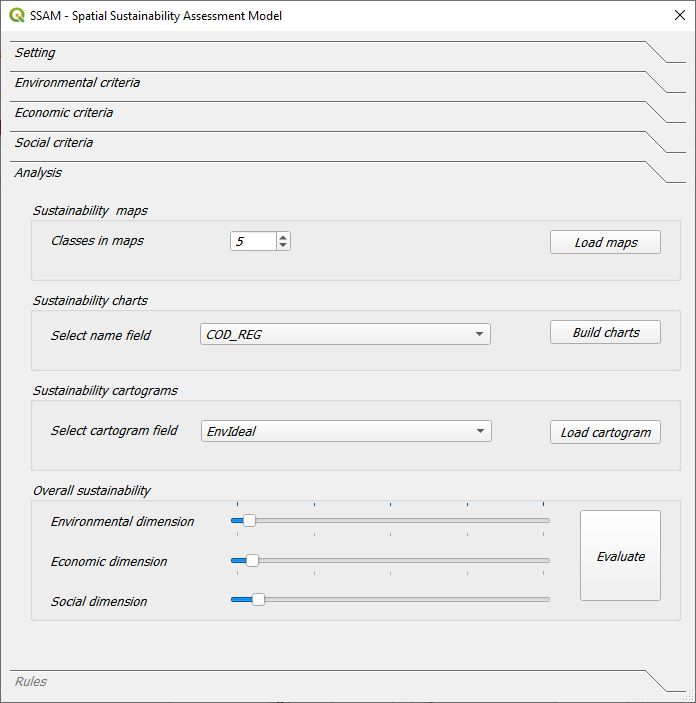
Figure 6: Analysis phase
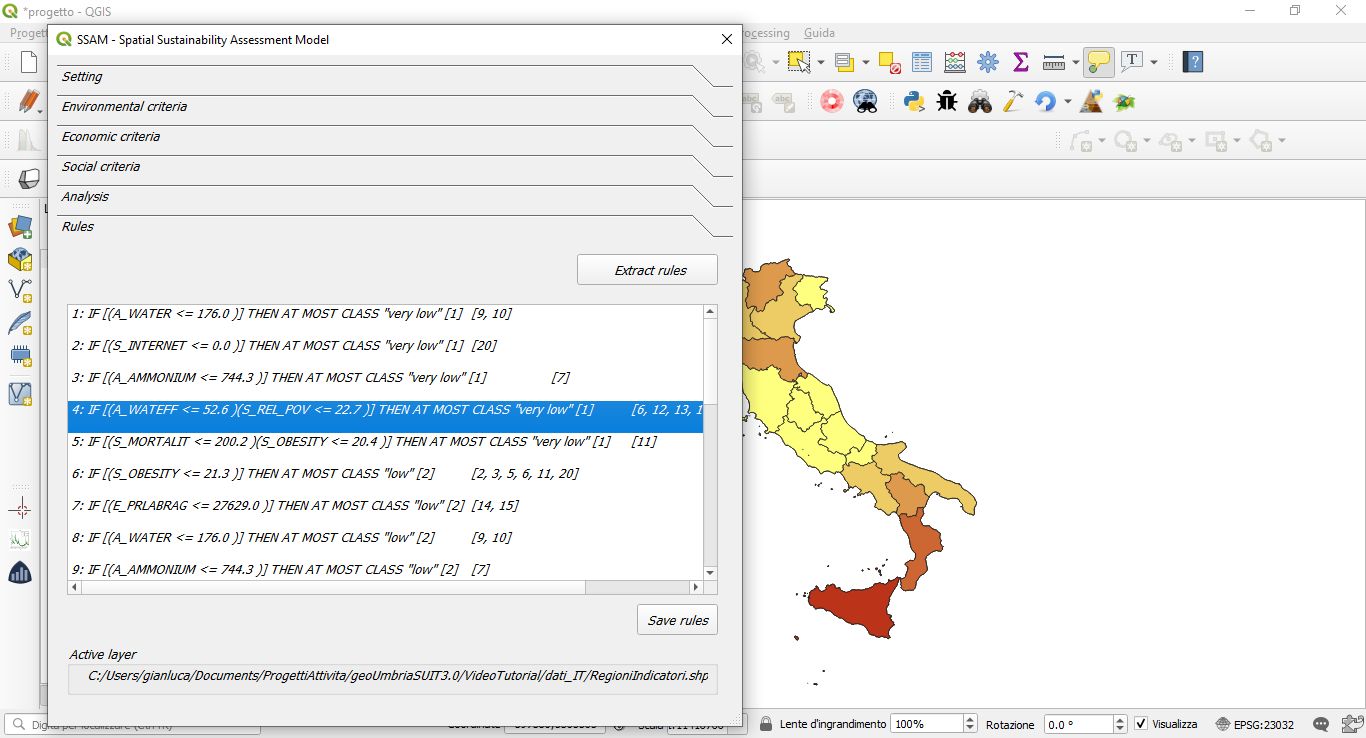
Figure 7: Rules
.